
Fitzgerald learning importance of business analytics
Friday, April 7, 2023
Somehow, we’re already over halfway through this semester! The second semester always seems to fly by, especially after spring break. This is my second update on my marketing analytics class taught by professor Jerry Rackley. The last time I posted, we were beginning to explore the value of marketing analytics, the ways in which it can be used and the struggles with implementing data to make a change. We have completed our Buzzfeed quizzes, and for those who were worried, our group ended with over the 2,000 required views. If you take this class in the future and need help with promoting your quiz, please reach out because we had some unique ideas that made a huge difference at the last minute.
Since submitting the Buzzfeed quiz results, we have learned about different programming tools including JavaScript, Excel, SAS, SPSS, SQL, Python, R and Hadoop. It’s so impressive what these tools are capable of doing. I took (and passed!) the first exam, and then we began to cover regression analysis and data visualization.
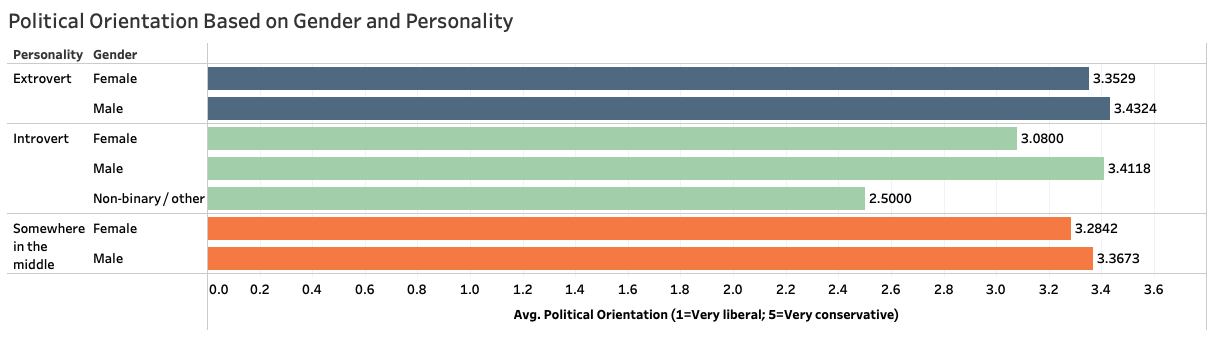
At the beginning of the semester, our class took a survey to provide information about our birth order, gender, personality, etc. We recently compiled this data and used it to create data visualization in Tableau. It was neat to play around in Tableau and explore all the ways to display a set of data, to make it simply informative and visually appealing. I am beginning to realize that marketing analytics isn’t as rigid as I originally thought. I’ve enjoyed combining my logical side to decipher complex data with my creative side to best analyze and present information.
 We’re currently discussing the importance of using analytics to drive marketing decisions.
Marketing analytics, now more than ever, is necessary for companies to maximize their
return on investments and optimize business performance. As companies increase their
digital marketing campaigns, analytics are vital to monitor the performance including
website traffic and social media engagement.
We’re currently discussing the importance of using analytics to drive marketing decisions.
Marketing analytics, now more than ever, is necessary for companies to maximize their
return on investments and optimize business performance. As companies increase their
digital marketing campaigns, analytics are vital to monitor the performance including
website traffic and social media engagement.
Data and analytics are used in every major company’s marketing effort. Streaming platforms including Netflix, Hulu and HBO collect viewing history data, ratings and search queries to create personalized recommendations for each customer to increase engagement and retention. They also specify data to target markets by curating campaigns toward different age groups, gender and genre preferences.
Rideshare apps like Uber and Lyft use analytics to determine competitive pricing that their customers are willing to pay. They analyze traffic and routes to estimate arrival times and improve efficiency. They also use a rating system to build trust and safety between the drivers and riders.
Analytics are even being used in the fashion world. Now, AI is developing algorithms to begin to master trend forecasting, which allows trends to filter through quicker than ever. Rather than relying on designers to promote the product through runway collections, social media allows influencers, fashion bloggers and anyone with a platform to be trendsetters. Analytics are necessary to keep up with this fast-paced market. Considering that most fashion trends cycle back around every few decades, analytics are necessary to track these changes, identify the key trends in time of changes and anticipate the next change.
This is evident in personalized fashion subscription boxes, like StitchFix. These companies use data and analytics in every decision from the inventory management, marketing, matching stylists to clients, route of delivery and obviously with piecing together the style box. Before a client even creates an account, StitchFix begins collecting data with a unique personalized style quiz that allows customers to answer questions about preferred fashion trends, color palettes and sizing.
It’s fascinating to learn the internal use of marketing analytics through the creation and presentation of data visualizations, then see the impact of implementing it to increase profits and improve customer experience in the ways that these companies have. I’m starting to geek out about all of this. I’ll see you guys in a couple weeks for another update.
Story By: Katie Fitzgerald | kaitlyn.fitzgerald@okstate.edu